MS SQL Server サンプルデータの AdventureWorksDW2019 スキーマを使って T-SQL を覚えるメモ。
ファクトテーブルの dbo.FactInternetSales と関連ディメンションテーブルを結合して、ユーザーの購入カテゴリを集計してベン図にするためのデータを抽出する。
declare @startdate date = '2013-01-01';
declare @enddate date = '2013-12-31';
with t1 as (
    SELECT
        s.[ProductKey],
        s.[CustomerKey],
		c.[CustomerAlternateKey],
		s.[OrderDate],
		s.[OrderDateKey],
		c.[Gender],
		c.[BirthDate],
		convert(int, format(c.[BirthDate], 'yyyyMMdd')) as i_birthdate,
		floor((s.[OrderDateKey] - convert(int, format(c.[BirthDate], 'yyyyMMdd'))) / 10000) as age,
		c.[DateFirstPurchase],
		c.[GeographyKey],
		g.[CountryRegionCode],
        d.[FullDateAlternateKey],
        convert(varchar(7), format(d.[FullDateAlternateKey], 'yyyy-MM')) as year_month,
        s.[SalesOrderNumber],
        s.[SalesOrderLineNumber],
        s.[OrderQuantity] * s.[UnitPrice] as revenue,
        pc.[EnglishProductCategoryName] as category,
        psc.[EnglishProductSubcategoryName] as subcategory,
        p.[EnglishProductName] as productname
    FROM
        [dbo].[FactInternetSales] as s
        inner join [dbo].[DimDate] as d on s.[OrderDateKey] = d.[DateKey]
	inner join [dbo].[DimCustomer] as c on s.[CustomerKey] = c.[CustomerKey]
	inner join [dbo].[DimGeography] as g on c.[GeographyKey] = g.[GeographyKey]
        inner join [dbo].[DimProduct] as p on s.[ProductKey] = p.[ProductKey]
        left join [dbo].[DimProductSubcategory] as psc on p.[ProductSubcategoryKey] = psc.[ProductSubcategoryKey]
        left join [dbo].[DimProductCategory] as pc on psc.[ProductCategoryKey] = pc.[ProductCategoryKey]
    where
        1 = 1
        and s.[OrderDate] between @startdate and @enddate
),
t2 as (
    select
        t1.[CustomerAlternateKey],
        sign(sum(case when t1.[category] = 'Bikes' then 1 else 0 end)) as bikes,
        sign(sum(case when t1.[category] = 'Clothing' then 1 else 0 end)) as clothing,
        sign(sum(case when t1.[category] = 'Accessories' then 1 else 0 end)) as accessories
    from
        t1
    group by
        t1.[CustomerAlternateKey]
),
t3 as (
    select
        t2.[bikes],
        t2.[clothing],
        t2.[accessories],
        count(1) as cnt
    from
        t2
    group by
        rollup(t2.[bikes], t2.[clothing], t2.[accessories])
)
select
    t3.[bikes],
    t3.[clothing],
    t3.[accessories],
    t3.cnt
from
    t3
where
    t3.[bikes] is not null
    and t3.[clothing] is not null
    and t3.[accessories] is not null;
結果はこうなる。
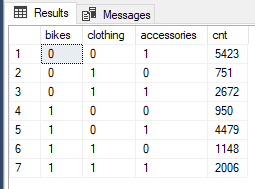
T-SQL でベン図用データを集計
PowerBI で表示するとこうなる。
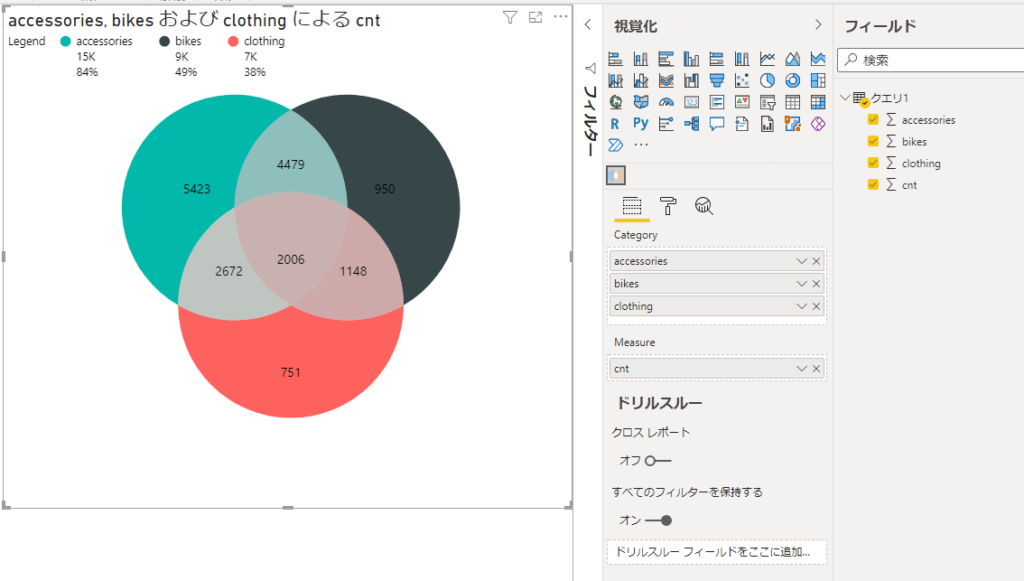
PowerBI でベン図を表示
ベン図ビジュアルは Venn Diagram by MAQ Software を追加して利用した。
参考図書
ビッグデータ分析・活用のためのSQLレシピ
SQL Server 2016の教科書 開発編