MS SQL Server サンプルデータの WideWorldImportersDW スキーマを使って T-SQL を覚えるメモ。
Fact.Sale と Dimension.Date で月別受注・受注累計・移動年計による Z チャート用データを抽出するクエリ
DECLARE @end_date date;
SELECT
    @end_date = EOMONTH('2014-12-01');

with t1 as (
    SELECT
        s.[Invoice Date Key] as sale_date,
        d.[Calendar Month Number] as sale_month,
        d.[Calendar Year] as sale_year,
        d.[Calendar Month Label] as sale_yearmonth,
        sum(s.[Total Including Tax]) as total_sale
    FROM
        [WideWorldImportersDW].[Fact].[Sale] as s
        inner join [Dimension].[Date] as d on s.[Invoice Date Key] = d.[Date]
    where
        s.[Invoice Date Key] between '2013-01-01'
        and @end_date
    group by
        s.[Invoice Date Key],
        d.[Calendar Month Number],
        d.[Calendar Year],
        d.[Calendar Month Label]
),
t2 as (
    SELECT
        t1.[sale_year],
        t1.[sale_month],
        t1.[sale_yearmonth],
        sum(t1.[total_sale]) as month_total_sale
    FROM
        t1
    group by
        t1.[sale_year],
        t1.[sale_month],
        t1.[sale_yearmonth]
),
t3 as (
    SELECT
        t2.[sale_year],
        t2.[sale_month],
        t2.[sale_yearmonth],
        t2.[month_total_sale],
        sum(
            case when t2.[sale_year] = 2014 then t2.[month_total_sale] end
        ) over(
            order by
                t2.[sale_year], t2.[sale_month] rows unbounded preceding
        ) as agg_sale,
        sum(t2.[month_total_sale]) over (
            order by
                t2.[sale_year], t2.[sale_month] rows between 11 preceding and current row
        ) as year_avg_sale
    FROM
        t2
)
select
    t3.[sale_year],
    t3.[sale_month],
    t3.[sale_yearmonth],
    t3.[month_total_sale],
    t3.[agg_sale],
    t3.[year_avg_sale]
from
    t3
where
    t3.[sale_year] = 2014
order by
    t3.[sale_year],
    t3.[sale_month];
結果はこうなる。
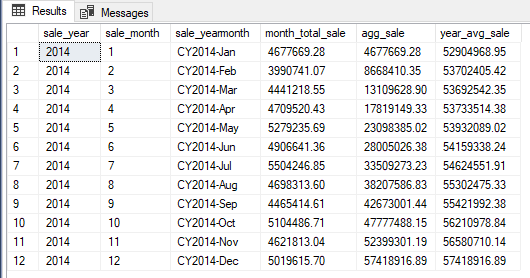
2014 年の月別受注・受注累計・移動年計を抽出
PowerBI で表示するとこうなる。
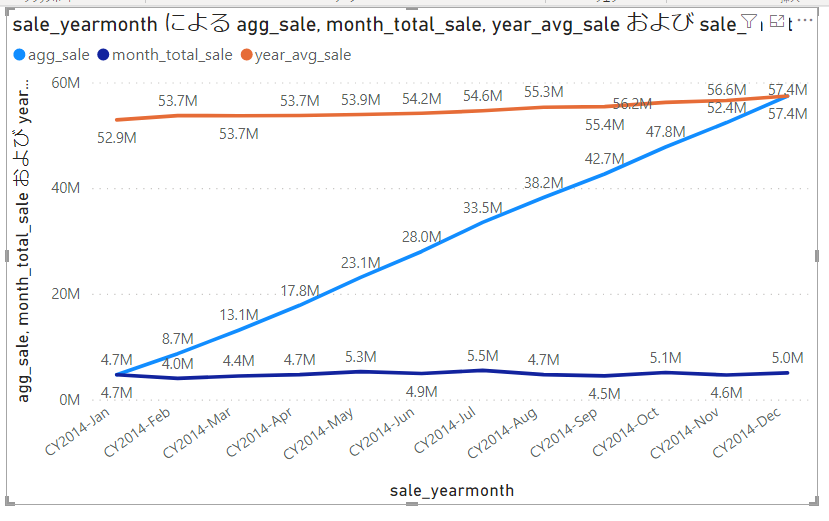
PowerBI で 月別受注・受注累計・移動年計を Z チャート表示
参考図書
ビッグデータ分析・活用のためのSQLレシピ
SQL Server 2016の教科書 開発編